

The crypto market presents highly lucrative opportunities but also significant challenges for newcomers. Success requires more than just understanding cryptocurrency, it demands the ability to analyze market price fluctuations effectively. This may seem complex for beginners, but do not worry! This article will provide a thorough guide to analyzing bitcoin prices, covering fundamental concepts and technical analysis. That enables you to master the market and make well-informed investment decisions.
Bitcoin was created in 2009 and is the world's first and most renowned cryptocurrency. It is also an online payment method and operates as an independent currency, not reliant on central banks or governments. Bitcoin is not only a digital currency but also a symbol of the technologization of finance. Today, Bitcoin has become an investment trend, attracting the attention of both novice and seasoned investors.

Before delving into how to analyze price movements, it is advisable to understand several fundamental concepts:
The price chart shows Bitcoin's value over time. It offers a visual view of Bitcoin's price trends, helping investors identify trading opportunities and refine their investment strategies. It is necessary to grasp three common types of charts if you want to develop an effective investment strategy:
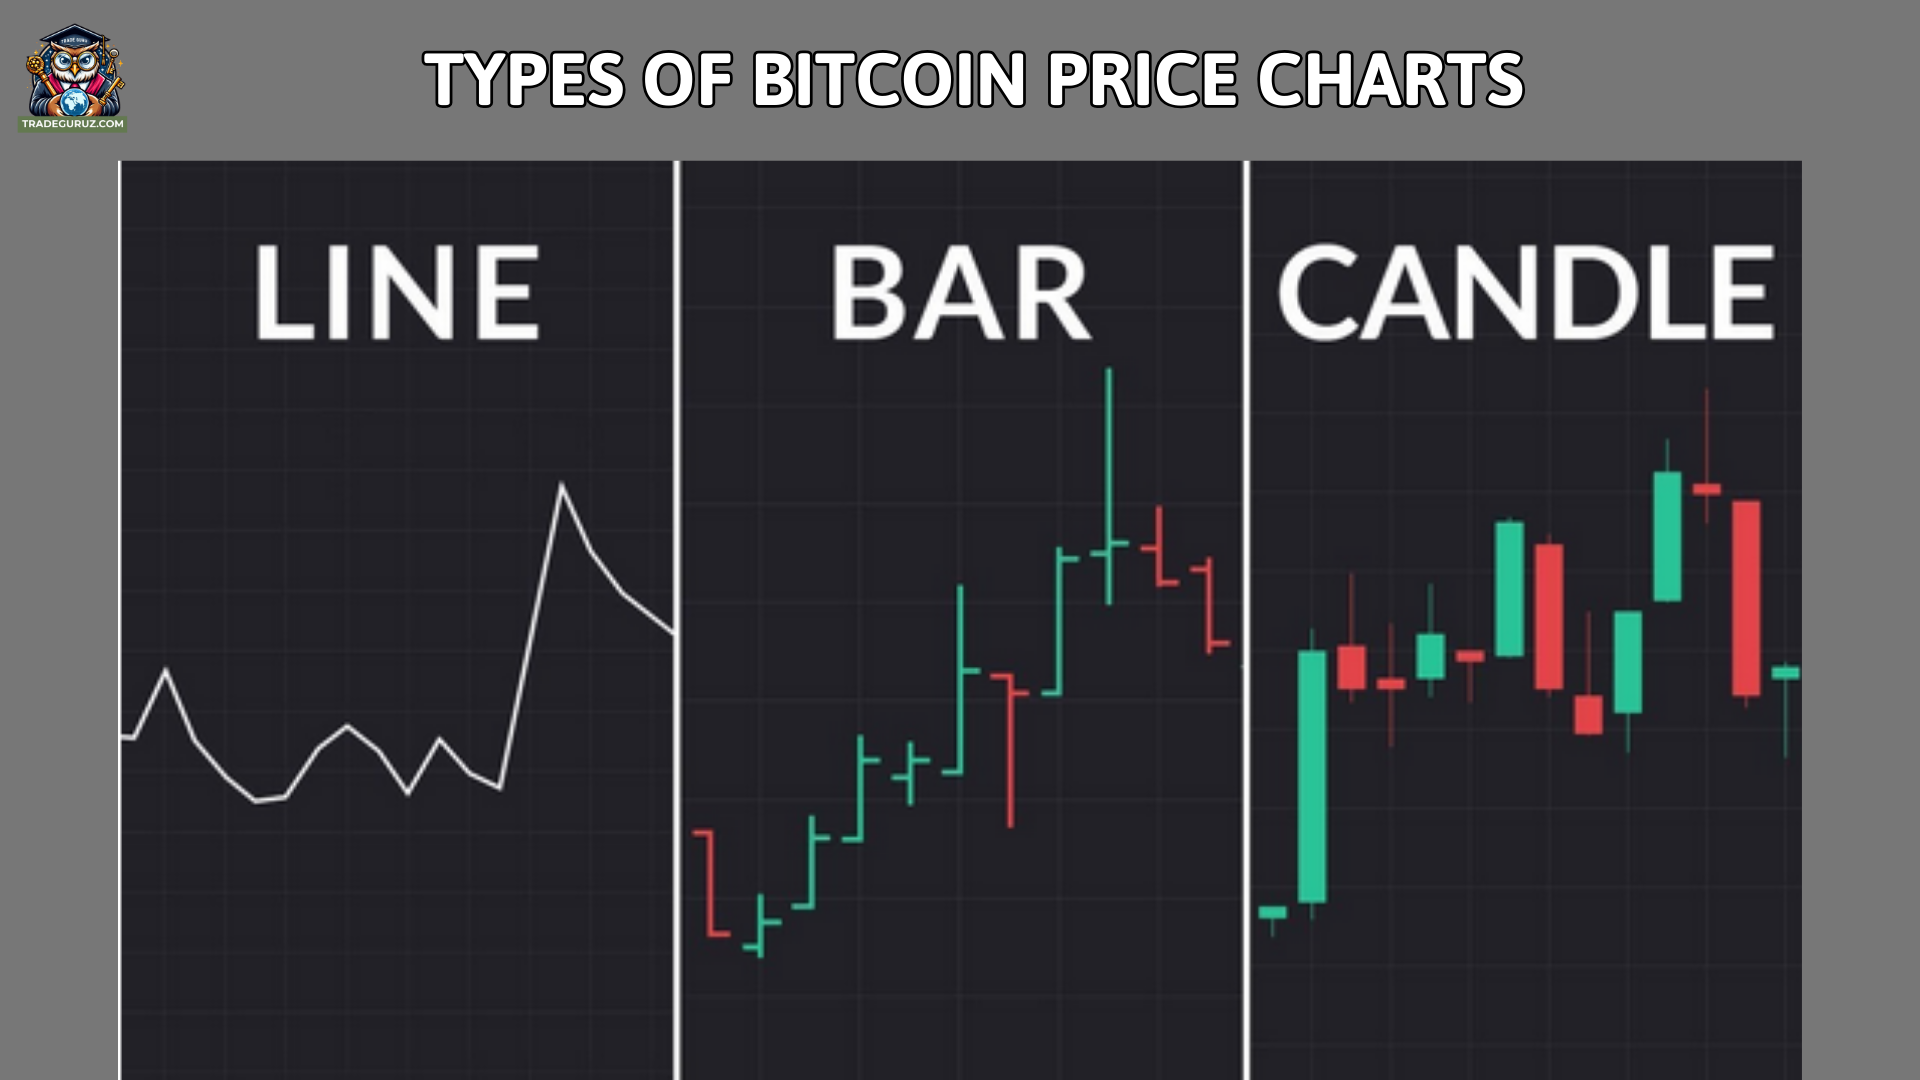
The Candlestick chart is one of the most popular chart types in technical analysis. Each candlestick in the chart represents Bitcoin's price over a specific period, such as one day, one hour, or 30 minutes. A candle comprises four elements: open, close, high, and low prices in the selected period. If the closing price is higher than the opening price, the candlestick will be green, indicating an uptrend. Conversely, if the closing price is lower than the opening price, the candlestick will be marked red, indicating a downtrend.
The line chart is the simplest type of chart, showing the price as a continuous line over specific periods. This line allows users to identify the overall trend of Bitcoin's price easily, but it does not deliver detailed information about the opening, highest, or lowest prices within each time frame. For this reason, line charts are typically used for long-term analysis, providing a broad view of the overall trend without delving into smaller changes.
For example, if Bitcoin's price rises from $10,000 to $20,000 over one year, the line chart will show a straight line moving from $10,000 to $20,000.
The bar chart has a similar structure to the candlestick chart but only displays the opening and closing prices of Bitcoin during a specific time. For instance, if Bitcoin opens at $10,000 and closes at $11,000 during a trading session, the bar chart will show a bar with the opening price at $10,000 and the closing price at $11,000.

The price of Bitcoin is displayed on the y-axis of the chart, reflecting price changes over time. An upward movement signifies an uptrend, whereas a downward movement indicates a downtrend.
The x-axis of the chart typically represents time, showing trading time intervals such as minutes, hours, days, weeks, or months. If you want an overview of short-term price fluctuations, you can monitor the chart over a short period, such as 1 hour or 1 day. Conversely, long-term charts are often used to assess the overall market trend.
Trading volume is a crucial factor that helps investors understand the participation level of traders during a specific trading session. It is often shown with color on the chart.
Market trends indicate the direction of Bitcoin's price over the long term. There are three main types of Bitcoin trends that investors should focus on:
- Uptrend: Bitcoin's price gradually increases over time.
- Downtrend: Bitcoin's price gradually decreases over time.
- Sideways Trend: Bitcoin's price fluctuates within a narrow range, with no significant price movements.
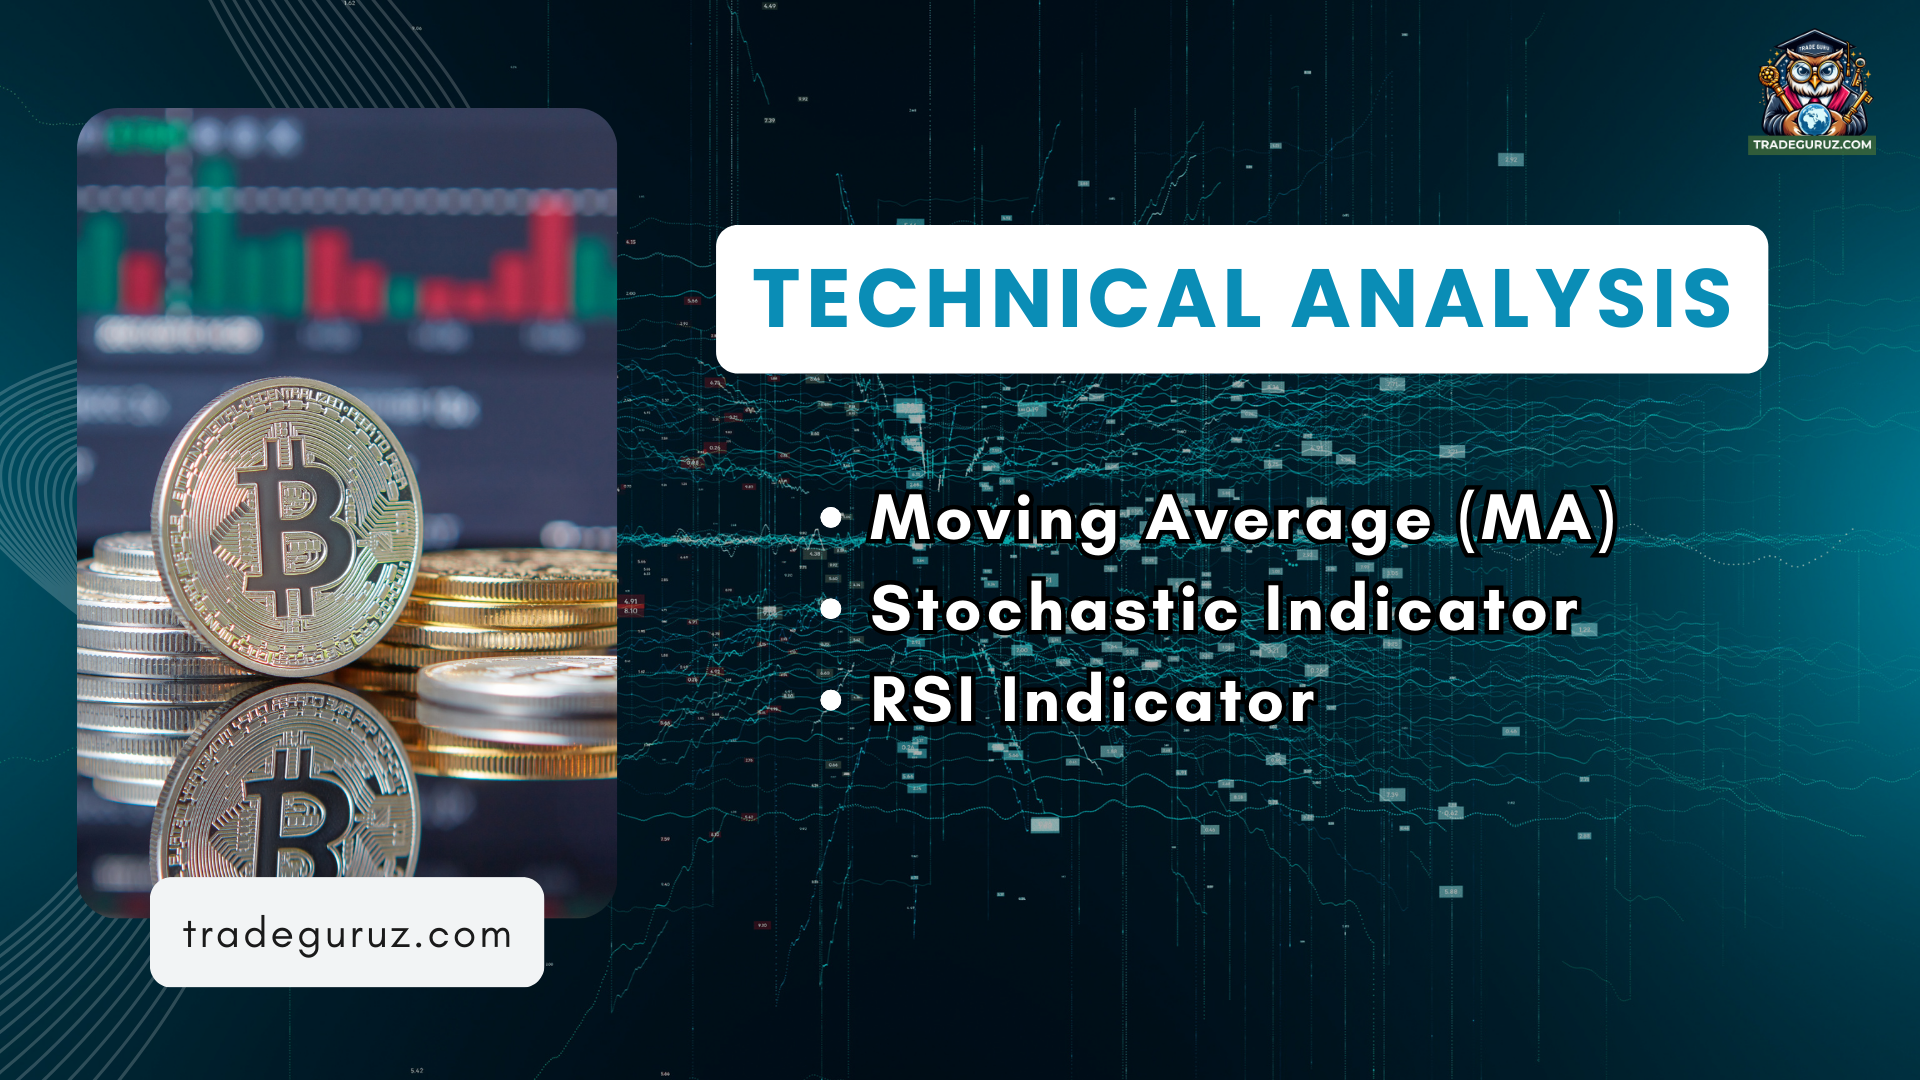
Once you understand the price trends, you can leverage technical indicators to conduct a detailed analysis of Bitcoin price data.
This technical indicator details the average price of Bitcoin over a specific period. Traders can utilize the MA line to identify price trends and potential entry and exit points. When the price moves above the MA line, it typically indicates an uptrend, and a price below the MA line generally signals a downtrend. Common types of moving averages include:
- Short-term MA: MA10, MA20
- Medium-term MA: MA50
- Long-term MA: MA100, MA200, MA730
This helps identify overbought or oversold conditions in the market. It fluctuates between 0 and 100, with two main lines: %K (the fast line) and %D (the slow line). When the indicator rises above 80, it suggests the market may be overbought, potentially leading to a price correction. Conversely, if it falls below 20, it indicates the market might be oversold, signaling a possible price rebound. If the %K line crosses above the %D line from below 20, it is a strong buy signal. Conversely, if %K crosses below %D from above 80, it is a strong sell signal.
The RSI measures the strength of a price trend and ranges from 0 to 100. When the RSI is above 70, the market may be overbought, and when it is below 30, it may be oversold. This indicator enables investors to identify reasonable entry and exit points, reducing the risk of buying at high or selling at low prices.
The open and close prices help you understand the price movement during a specific trading session. The open price is the first price at the beginning of the session, while the close price is the final price. By comparing the open and close prices over several days within a given timeframe, you can easily determine whether the price of Bitcoin is trending upward or downward.
The high and low prices reflect bitcoin volatility. The difference between the high and low prices can indicate the risk level and market uncertainty. A large price range signals strong market volatility, while a small price range suggests the market is stable or moving sideways.
Trading volume represents the total amount of Bitcoin bought or sold within a specific time. High trading volume indicates significant investor interest and is often associated with powerful market trends. In contrast, low trading volume may signal investor hesitation or lack of interest, potentially resulting in a sideways market.
Market cap is the total value of all circulating Bitcoin. An increase in market capitalization signifies a rise in Bitcoin's value. Conversely, a decrease in market capitalization may indicate a bearish trend.

To enhance your investment efficiency, it is recommended to develop an intelligent strategy for forecasting Bitcoin’s price. Below are some tips to help you sharpen your forecasting skills to maximize your potential returns in the crypto market.
Long-term trends offer an overall view of Bitcoin’s future price, enabling you to determine whether Bitcoin is in a growth cycle, experiencing a downturn, or moving sideways. Identifying trends in the long term helps you develop an appropriate trading strategy and avoid being swayed by insignificant short-term fluctuations.
Technical indicators are essential tools for predicting price movements, but using too many indicators tends to noise. Each indicator serves a unique purpose, making it crucial to understand its characteristics to prioritize which option aligns with your trading objectives. Remember, a well-balanced combination of indicators will give you more opportunities while minimizing risks.
Not all timeframes are suitable for every strategy. Choosing the right timeframe is essential for aligning your strategy with the market's rhythm, allowing you to respond to market movements in a timely and accurate manner. If you are a newbie, try analyzing charts in long-term timeframes to gain an overall market perspective before transitioning to a shorter one.
Although charts deliver valuable information, they are not everything. Charts reflect historical data but cannot predict every sudden price fluctuation. Bitcoin prices can be influenced by external factors such as news, regulatory policies, and investor sentiment. Therefore, staying informed about current news and monitoring investor reactions to price movements is essential for refining your investment strategy in line with market trends.
Analyzing Bitcoin prices requires a comprehensive approach that understands price trends, technical indicators, and market data to make a profitable choice. Start by interpreting a price chart, where the y-axis shows Bitcoin price changes over time and the x-axis reflects trading periods. Short-term charts are useful for assessing immediate price movements, while long-term charts help identify broader market trends.
Additionally, sentiment analysis is equally important in determining BTC's price. You can gauge market sentiment through social media, broader economic events, news headlines, and investor behavior. That way, you can gain insights into the likeliness of price fluctuations. In addition, considering macro factors such as inflation, interest rates, and global market trends also helps your judgment be more accurate. Because these values also have a significant impact on the price of Bitcoin.
Ultimately, Bitcoin's value can change so dramatically, that there's a higher likelihood of significant losses if trades or investments are not carefully planned, so you are required to have a careful risk management strategy. Avoid excessive leverage, set stop losses, and stay updated on market conditions. With a disciplined and well-rounded approach, you can better navigate the complexities of Bitcoin price analysis and improve your trading or investing results.
Thank you for taking the time to read the entire post.
For more detailed information, please contact us at TRADEGURUZ.
